Data Analytics conference - Daniel Krueger report
Seattle Sounders Inaugural Analytics Conference (6/22 – 6/23 2019)
Summary by: @DanielKrueger96
Organizers: @analysefooty @SSFCSpSci
#SSFCAnalytics
Day 1
Introduced Ravi Ramineni – Director of Analytics, Seattle Sounders FC
General takeaways: There seems to be a common theme with sports front offices. Team presidents and GMs rarely have a data background. The role of an in-house analyst is fairly new, so this makes sense. Though front office management may not have an understanding of the technical side of the analyst’s day to do task, it is important for a front office to have an understanding that analytics and data-driven decision making is key for developing a club. Lagerway brought up a very good point that because the vast majority of clubs don’t have someone in house on the interview team that has an analytics background, hiring the first member of an analytics staff can be difficult.
Integrating Analytics into the Workflow Ravi Ramineni @analysefooty - Director of Analytics – Seattle Sounders FC
General Takeaways: This was a very broad talk on the state of analytics as it pertains to the MLS. Ravi went through questions he is tasked with answering on a daily basis. He explained how the Sounders communication chain is set up.
A Whole New Ball Game: Augmenting Metrics at Scale with Broadcast Tracking Sam Gregory @GregorydSam & Evin Keane Data Scientists – Sportlogiq
Sportlogiq: AI-powered sports analytics
Gregory noted that their model was independent of pass selection
@andre_brener and I discussed the addition of a metric like @Karun1710’s xT to SportLogiq’s pressure index
https://karun.in/blog/expected-threat.html
General Takeaways: The tracking data that can be provided by a company like SportLogiq is undoubtedly the next data frontier after event data has become more mainstream (at least among that football analytics community). Larger leagues are now capturing some form of tracking data league wide. Broadcast tracking data is important when scouting opponents that are outside your league, or when looking at potential in smaller leagues for transfer. Especially for a league like the MLS, scouting players and teams in Latin America lends itself to the capture of broadcast tracking data. SportLogiq is certainly not the only player in this space. Stats inc @STATSOnThePitch, ChyronHego @ChyronHego, and Playvision all produce a similar product. SportLogiq is based in Montreal and has a number of jobs posted currently if you are interested in learning more about this company. https://sportlogiq.com/en/careers/
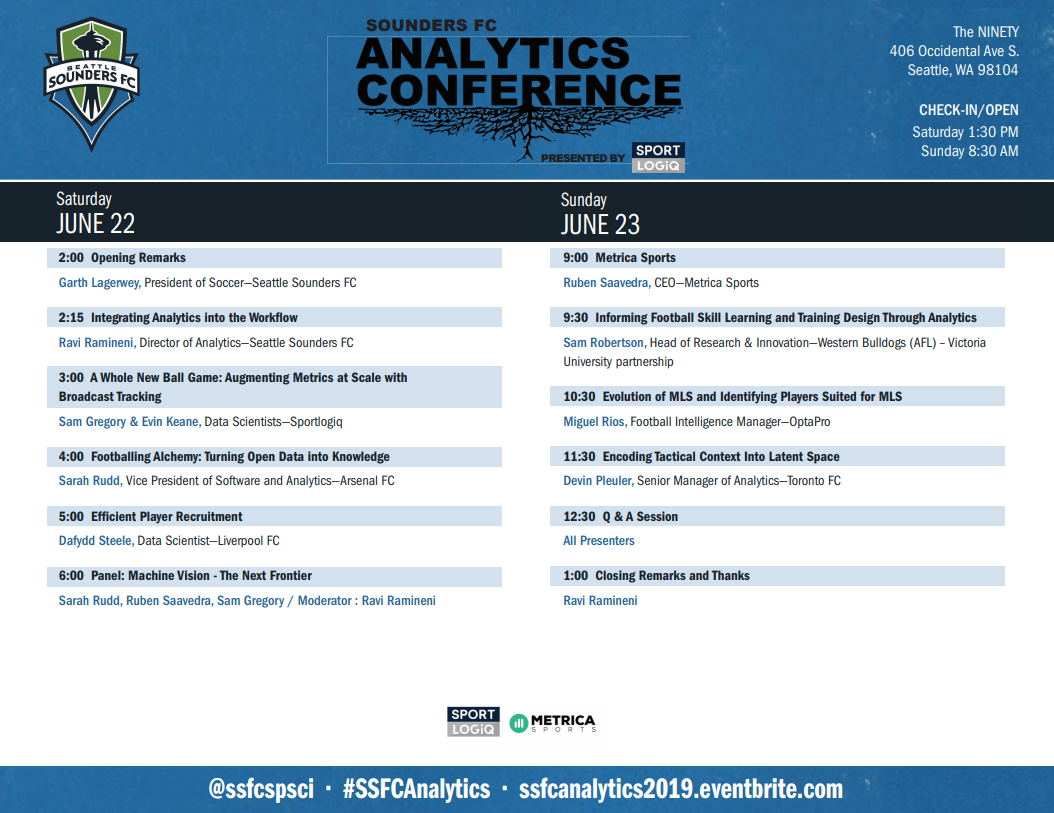
Football Alchemy: Turning Open Data into Knowledge Sarah Rudd @srudd_ok, Vice President of Software and Analytics – Arsenal FC
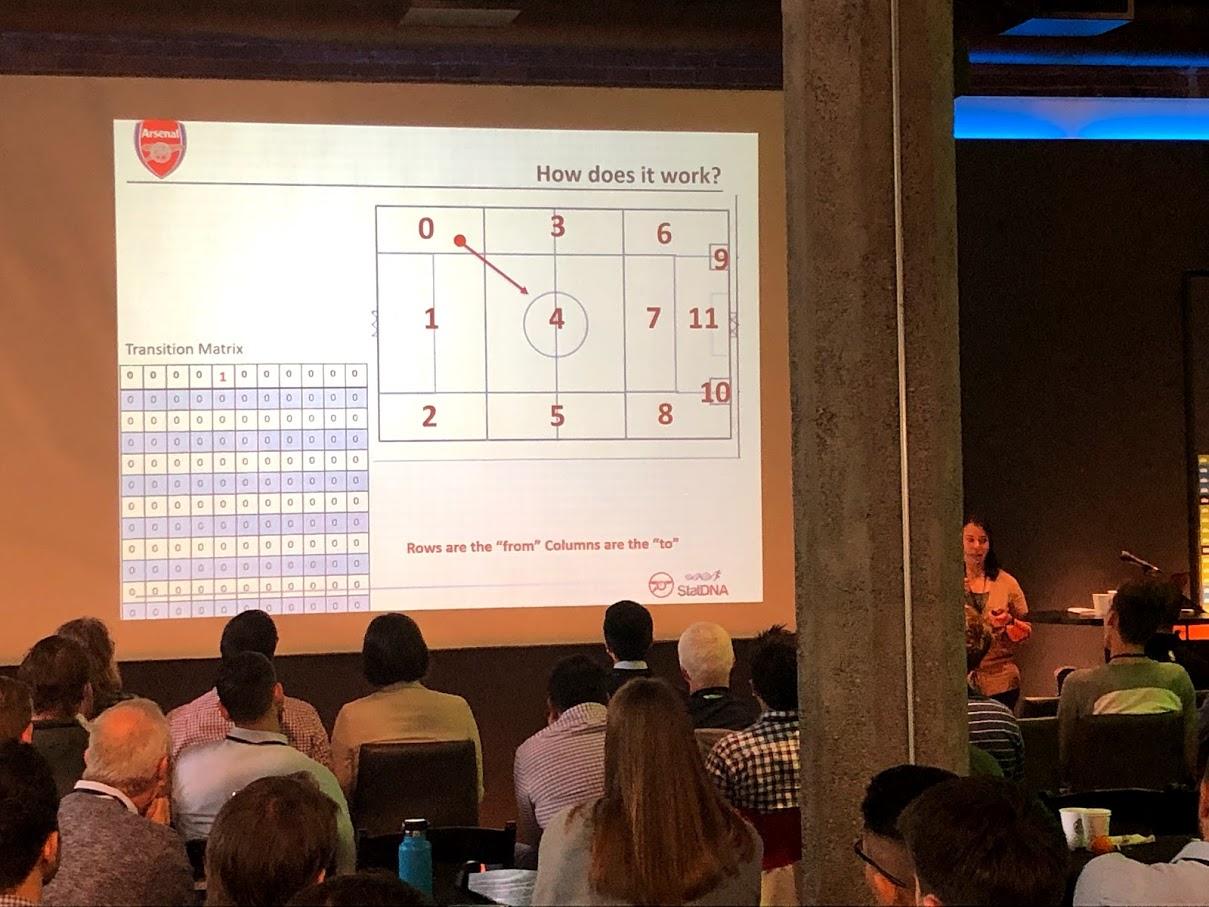
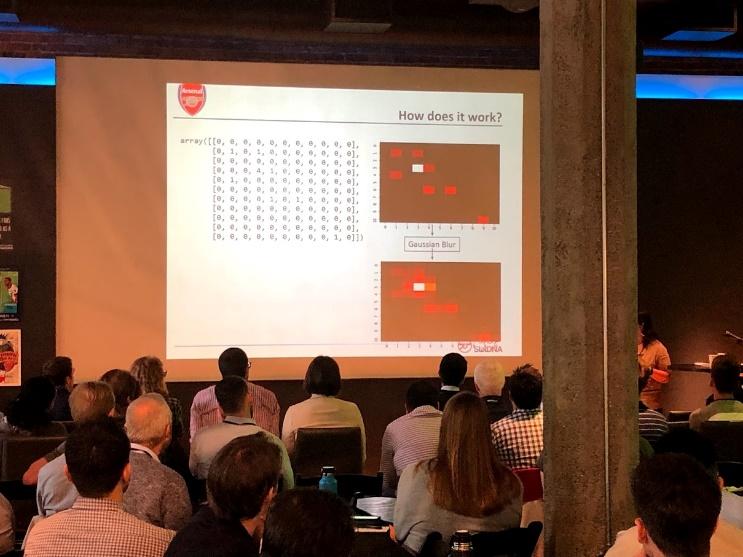
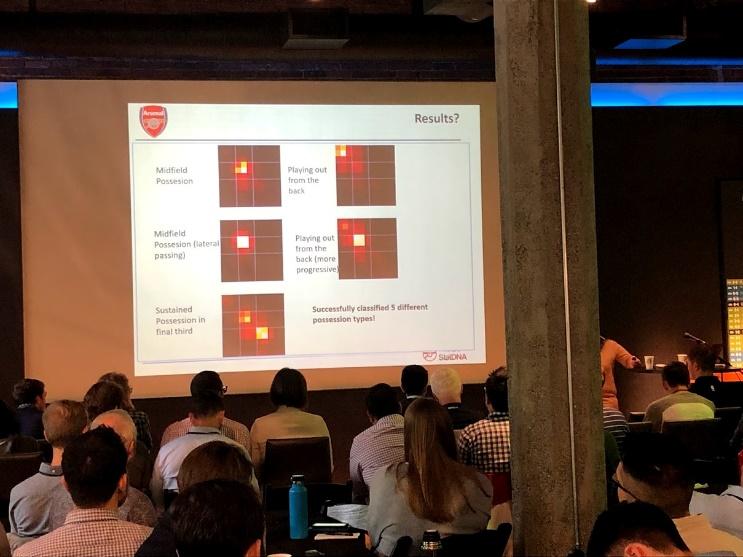
Rudd took attendees through the process Arsenal uses to build their state machine. Rudd finished with five different possession types pictured above
General Takeaways: Both @Mladen_Sormaz (Leicester City FC) and I remarked of the similarities and differences Rudd’s model took from Joe Mulberry’s (@joe_mulberry) Gazing into latent space to find an edge with possession sequences presentation at the Opta Pro Forum this past February. Though the utilization of state machines is largely in its infancy in football analytics, it’s encouraging to see it finding its way to these types of conferences.
Efficient Player Recruitment Dafydd Steele Data Scientist – Liverpool FC
A myriad of slides from Champions League winner Dafydd Steele on Liverpool’s IT, scouting, and communication structure. Steele also presented extensively on Liverpool’s pitch value model
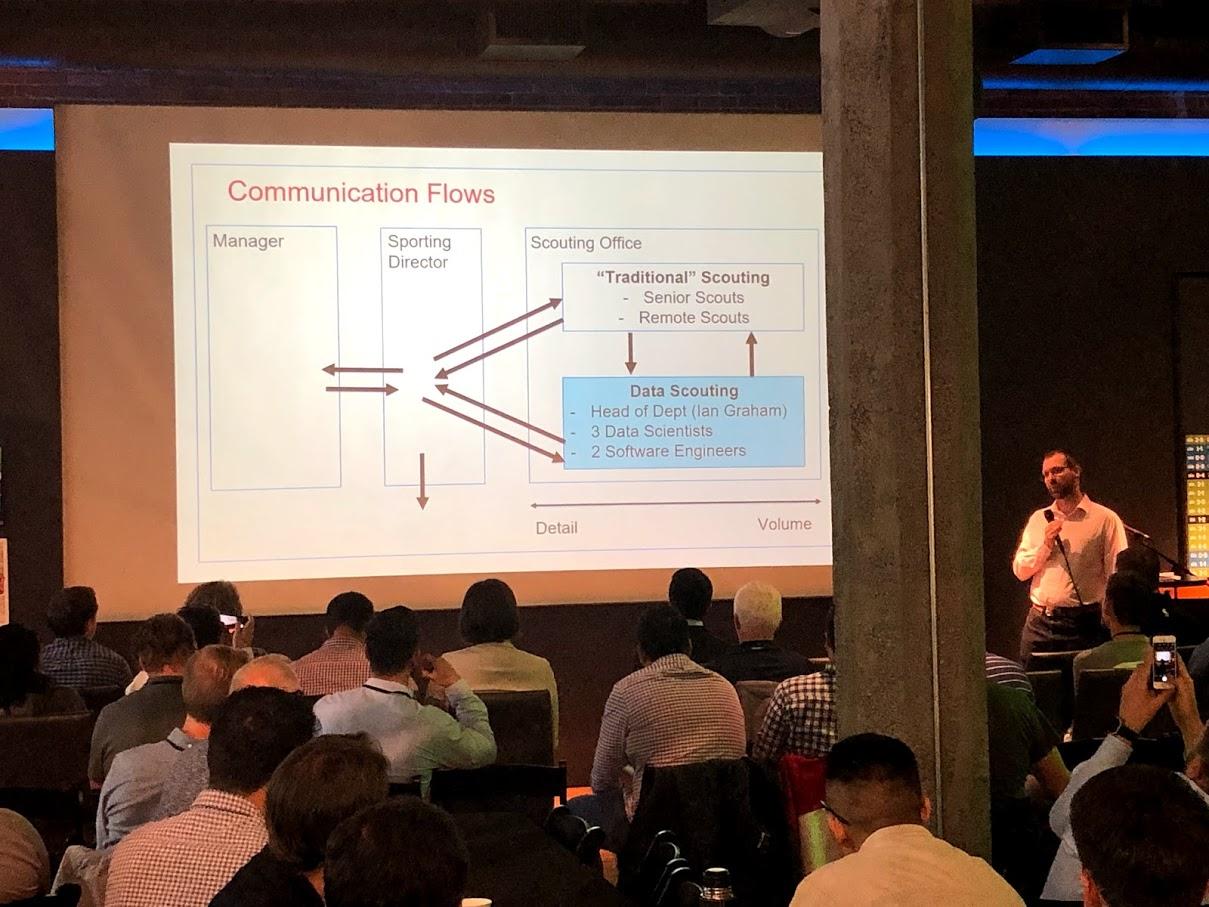
General Takeaways: I think I can speak for all the attendees when I say that this talk was absolutely fantastic. It’s not every day you get to listen to a data scientist from a club that just won the Champions League weeks prior. Because of club size and superior resources, a club like Liverpool has the ability to build out a large data team. Many clubs, even in top leagues are not afforded a similar ability. These clubs are putting out some of the best research on the market. It makes me wonder what more these club’s analytics groups are creating behind closed doors. Steele’s presentation showed his supreme knowledge of the role a “data scout” – a term that is new to me, but certainly fitting – plays in the entirety of a large club. He also understands that the coming of the new data age in football does not remove the role a traditional scout, but instead helps inform.
Day 2
Metrica Sports Ruben Saavedra, CEO – Metrica Sports
Metrica Sports
General Takeaways: This is a very well thought out company. Saavedra even said his business partners took about two years to just watch the industry and find a niche they could fill. I will admit, I walked into this talk about half way through, but Saavedra was part of both Q&A segments. He demonstrated a deep understanding of the state of football analytics and the niche that his company fills.
Informing Football Skill Learning and Training Design Through Analytics Sam Robertson @Robertson_SJ, Head of Research & Innovation – Western Bulldogs (Australian Football League)
Summary
Sport scientists in football should be investigators for improvement and a conduit for collaboration between departments/silos
Skill acquisition needs analytics in order to move the field forward
Sport science can help analytics by increasing the scope of applications and creating ultimately more jobs
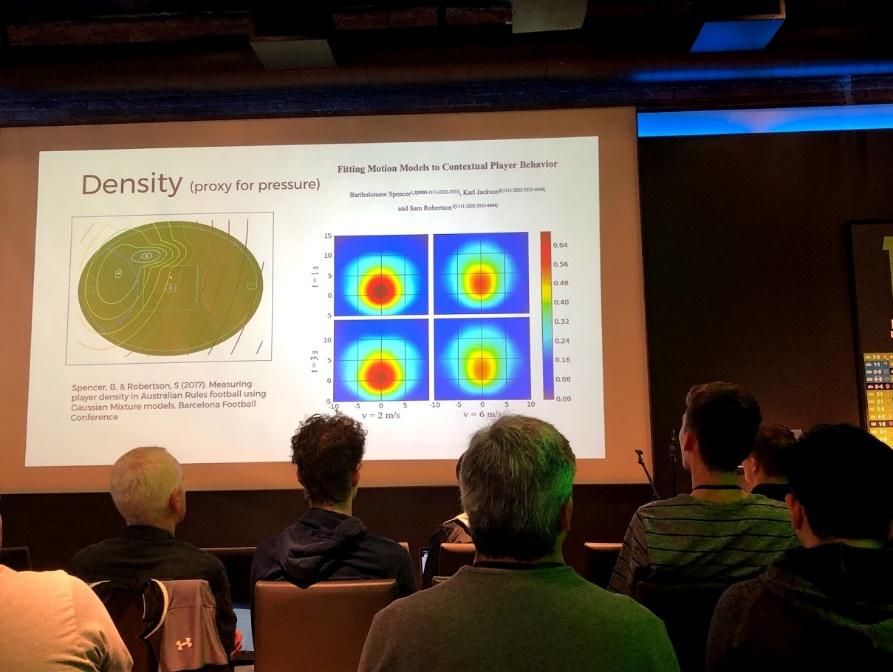
Robertson took attendees through various research projects he has published in his time as Head of Research & Innovation for the Western Bulldogs of the Australian Football League
General Takeaways: Full disclosure, I actually thought Robertson was from the other AFL (Arena Football League). “Wow, I wonder how an Australian made his way to the Arena Football League?” I guess I’ll chalk this up to the late night networking the night before? Robertson presented with more of an academic focus than any of the previous presenters. He is very well published in the sports science field. After the conference I took some time to read through some of his work, which I would highly recommend if you are at all interested in sports science. I would specifically point to Fitting Motion Models to Contextual Player Behavior (Spencer, Jackson, Robertson 2017). Check all his work out at https://www.researchgate.net/profile/Samuel_Robertson Admittedly, my knowledge of sports science is quite limited, and my knowledge of Australian League Football even more limited. I’ve heard terms like RPE and cognitive load but don’t totally understand how one would capture and apply such concepts other than “this player looks tired, let’s end his training session.” I thought Robertson’s take on the state of sports science was refreshing. I feel analytics is in a similar state regarding usage of advanced metrics using both event and tracking data. I still think there are loads of insights that can be built from a basic stat line of goals, shots, possession, home/away etc. Not only are basic metrics easier to produce, they are also easier to communicate in a more concise manner. Robertson spoke on a return to the core tenants of sports science and why it has been employed in football analytics in the first place. Making complexity interpretable and (more) objective.
Evolution of MLS and Identifying Players Suited for MLS Miguel Rios @miguelrios_, Football Intelligence Manager – Opta
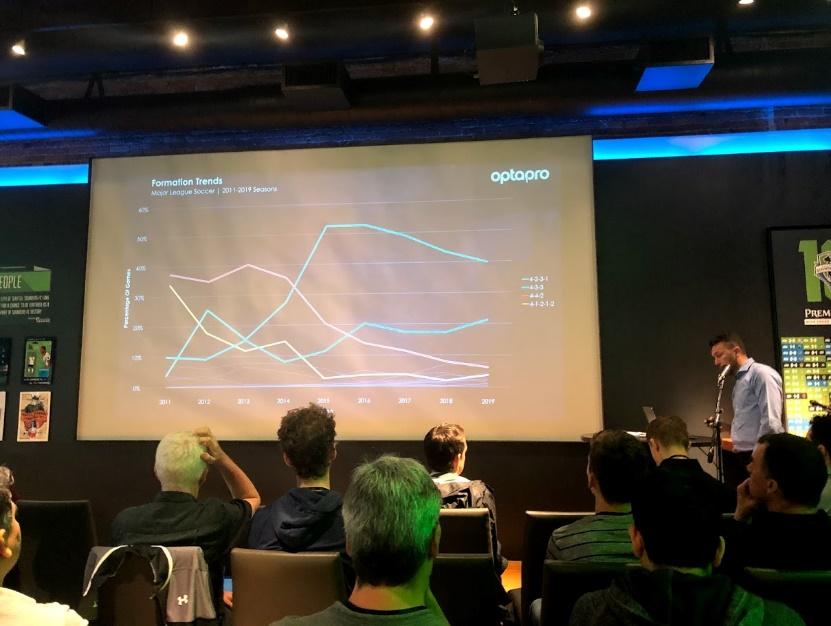
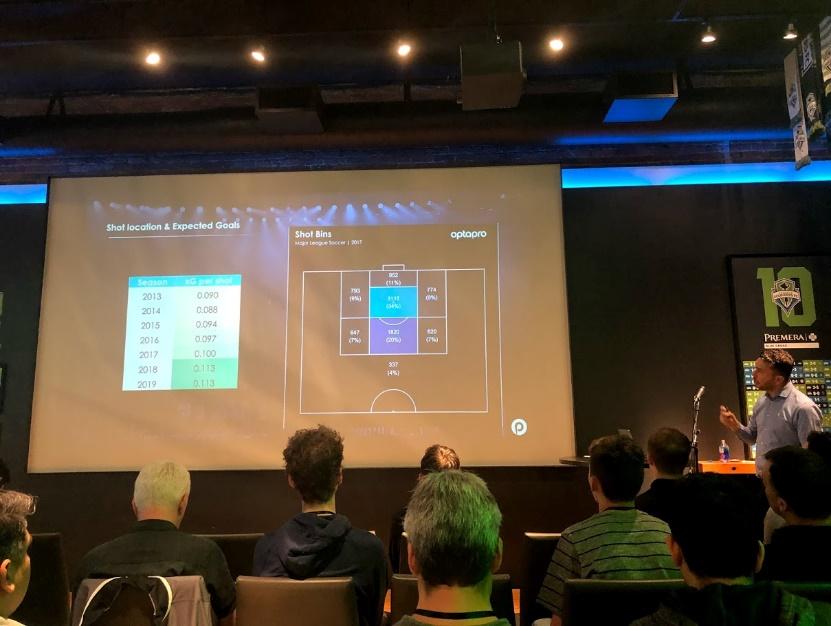
Rios #flexed with some @optapro #dataviz showing general trends of the MLS

General Takeaways: Rios has an almost unparalleled pedigree in the industry. He has worked for multiple clubs and now Opta, one of the more prominent firms in the football analytics, as the football intelligence manager. This presentation showed the best side of Opta: charts, graphs, advanced metrics. Having spent a large amount of time working for Opta’s F24 event files, I know that the backend work required to make these visuals is substantial, but it would make sense to think that Opta would be able to build these type of visuals out of their own event files. I tweeted out during the presentation that Rios was “flexing” some #dataviz which I wholeheartedly stand by. Opta have the best in-house visuals in the game at this point in time. Statsbomb are a close second. Not any huge takeaways from the conversation, but the visuals were definitely a highlight of the conference. Rios showed MLS positions acquired by team, loan market interaction, transferred player profiles, squad age profile and formation trends. The presentation itself was reminiscent of the approach Opta takes to the football analytics sphere: here is the data (F24 event files) and some stock visuals and now you do the actual analysis and build your own actionable insights. This sentiment allows for them to stay fluid and impartial in the team and league contracting space. Rios harped on some of the MLS big sells (Almiron, Davies etc) as a positive for the league. I would certainly agree. There isn’t a lack of athleticism in the MLS, but there is a lack of technical quality. As the league sells more players to bigger leagues, it will allow for continual investment in MLS academies, which will allow the league to continue to grow at the first team level.
Encoding Tactical Context into Latent Space Devin Pleuler @devinpleuler, Senior Manager of Analytics – Toronto FC
General Takeaways: Pleuler seemed to continue the theme of sacrificing complexity in order to better explain the tenants of a model. I did think this went somewhat against his actual presentation which centered on the largely difficult to explain concept of latent space. I also thought Pleuler spent a little bit too much time in the technical build of his model. The slide with python code probably lost a fair amount of the audience. The model itself however, is yet another fantastic application of a complex concept to bring more objectivity to football. I also really liked what Pleuler was saying about analytics as a way of saving time. The application of analytics sometimes strays from this simple concept. For a coach, let’s take the things that he/she does every day and see if we can save them time and bring more objectivity to their decision making.
Conference Overview:
Overall I thought the conference was really well done. The small space allowed for some really valuable conversation and networking amongst the relatively small MLS/American football analytics community. Events like these are extremely important over the next couple of years to continue to grow the space and share ideas. As more clubs join the MLS and hire analysts the community will undoubtedly grow. I would love MLS analysts to take the approach of NBA analysts, where (from the outside looking in) ideas and projects are shared widely amongst team analysts. As an analytics manager myself in the college space, I try to share projects and thought processes with as many other analysts as I can because, though my processes is no longer unique, I get the chance to learn from my colleagues and the overall state of our community is hopefully improved. MLS front offices largely encourage analysts to keep models and visuals in-house. Though the pay check of the analyst comes from the team, I would argue that, for the betterment of league, the collaboration and sharing of ideas league-wide will bring the overall level to a higher standard at a faster rate. I would also like the MLS to grow in its role as a resource for the in-house analysts. I’m certainly not arguing for the sharing of code and player evaluation ratings, but sharing ideas in more of a general sense. I want to give my thanks to Ravi Ramineni @analysefooty and Sounders Sports Science & Analytics @SSFCSpSci for all the hard work to bring this conference together. I’m sure it will be the first of many. See everyone next year!
Summary by: @DanielKrueger96
Organizers: @analysefooty @SSFCSpSci
#SSFCAnalytics
Day 1
- Opening Remarks Garth Lagerway, President of Soccer – Seattle Sounders FC
- Building an analytics department from scratch
- Starting with current roster: sports science emphasis (RPE, sleep, athlete surveys, performance testing
- Player recruitment
- Inherently less data on players outside of your own club because other clubs don’t release sports sci data
- Building automation
- Finding objectivity to allow for data driven decisions
Introduced Ravi Ramineni – Director of Analytics, Seattle Sounders FC
General takeaways: There seems to be a common theme with sports front offices. Team presidents and GMs rarely have a data background. The role of an in-house analyst is fairly new, so this makes sense. Though front office management may not have an understanding of the technical side of the analyst’s day to do task, it is important for a front office to have an understanding that analytics and data-driven decision making is key for developing a club. Lagerway brought up a very good point that because the vast majority of clubs don’t have someone in house on the interview team that has an analytics background, hiring the first member of an analytics staff can be difficult.
Integrating Analytics into the Workflow Ravi Ramineni @analysefooty - Director of Analytics – Seattle Sounders FC
- Analytic categories
- Scouting and analyzing your own team
- Finding players that fit your team
- Opposition scouting
- Chances
- “Not all chances are created equal”
- Reference to “Not All Passes Are Created Equal” (Power, Ruiz, Wei, Lucey 2017)
- Identifying player styles within your own system
- How does a team pick a style
- Coach and personal – expansion teams have a potential advantage when starting from scratch
- Avoids the “this is how we have always done things” sentiment
- Self-scouting
- Using data to explain who we are
- Identifying important elements to create the ideal version of your chosen style
- Ex. Attack Prime Assist Zones (PAZ)
- Finding what is truly optimal for implementation
- What do other (better) teams with a similar style do differently
General Takeaways: This was a very broad talk on the state of analytics as it pertains to the MLS. Ravi went through questions he is tasked with answering on a daily basis. He explained how the Sounders communication chain is set up.
A Whole New Ball Game: Augmenting Metrics at Scale with Broadcast Tracking Sam Gregory @GregorydSam & Evin Keane Data Scientists – Sportlogiq
Sportlogiq: AI-powered sports analytics
- Began as a hockey event data provider
- Broadcast tracking
- Can track other leagues
- Context
- Tracking data not just on ball
- Advanced metrics such as xG don’t account for off ball info
- Measuring defensive pressure
- Finding a team pressure rating
- Non-binary pressure rating
- Continuous pressure applied by team
- Pressure index
- Logistic regression model of passing completion under pressure
- Passing ability across a range of pressure scenarios by taking the area under the logistic regression sigmoid curve
- Player’s passing completion rate as a function of pressure applied
- Gaussian PDF centered around each defender
- Evaluate each PDF at the location of the passer
- Sum above two values
- PDF parameters constant for all players on all passes and optimized to reduce the error of a pressure-based pass completion model
- Application: Metric for passing ability
- Concerns were raised among the crowd for this metric
- Could a player scoring high in this area simply pass backwards? A player choosing low risk, low reward passes may score high in the SportLogiq model
Gregory noted that their model was independent of pass selection
@andre_brener and I discussed the addition of a metric like @Karun1710’s xT to SportLogiq’s pressure index
https://karun.in/blog/expected-threat.html
General Takeaways: The tracking data that can be provided by a company like SportLogiq is undoubtedly the next data frontier after event data has become more mainstream (at least among that football analytics community). Larger leagues are now capturing some form of tracking data league wide. Broadcast tracking data is important when scouting opponents that are outside your league, or when looking at potential in smaller leagues for transfer. Especially for a league like the MLS, scouting players and teams in Latin America lends itself to the capture of broadcast tracking data. SportLogiq is certainly not the only player in this space. Stats inc @STATSOnThePitch, ChyronHego @ChyronHego, and Playvision all produce a similar product. SportLogiq is based in Montreal and has a number of jobs posted currently if you are interested in learning more about this company. https://sportlogiq.com/en/careers/
Football Alchemy: Turning Open Data into Knowledge Sarah Rudd @srudd_ok, Vice President of Software and Analytics – Arsenal FC
- StatDNA
- Bought out by Arsenal FC in December, 2012 for a reported £2.165m
- State Machine
- Treat situations as states and events as transitions
- Building a transition matrix and using Gaussian Blur
- Examining the process of “how we arrived” at the state
- Building clusters of similar possessions – Rudd’s system identified five passing clusters
- Unsupervised
- Potential future studies - LSTM Auto Encoders
- Used for language translation
Rudd took attendees through the process Arsenal uses to build their state machine. Rudd finished with five different possession types pictured above
General Takeaways: Both @Mladen_Sormaz (Leicester City FC) and I remarked of the similarities and differences Rudd’s model took from Joe Mulberry’s (@joe_mulberry) Gazing into latent space to find an edge with possession sequences presentation at the Opta Pro Forum this past February. Though the utilization of state machines is largely in its infancy in football analytics, it’s encouraging to see it finding its way to these types of conferences.
Efficient Player Recruitment Dafydd Steele Data Scientist – Liverpool FC
- Process
- Building the communication flow within the team
- Communication Structure
- Backend coders to first team coaching staff
- Player recruitment at Liverpool
- Traditional scout sharing information with the “data scout”
- Emphasized the give and take between these stakeholders
- Giving players time to succeed at a club
- Similar to any modeling project. Need a large sample size to properly evaluate player performance
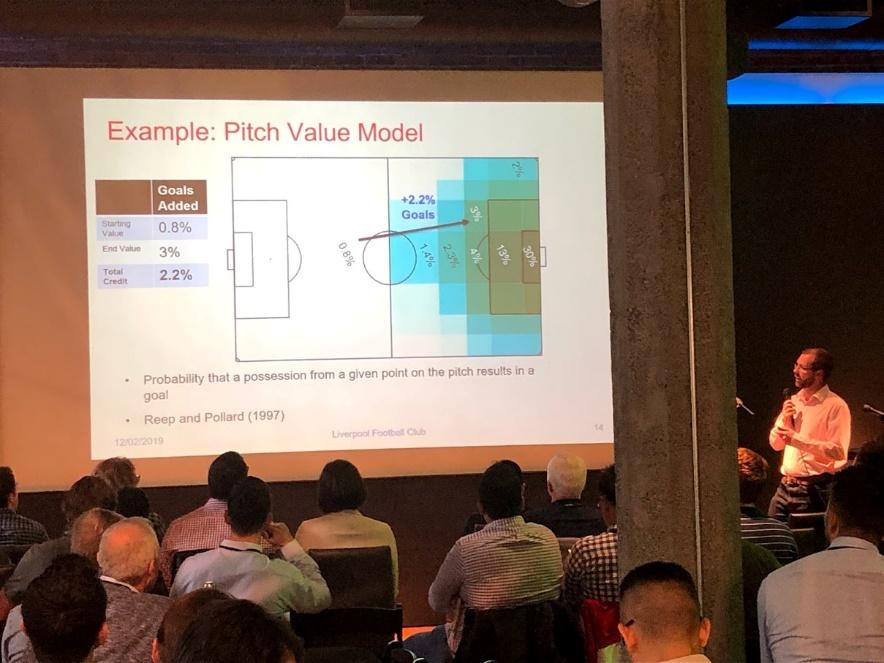
- Pitch Value Model
- Efficient Recruitment
- Need buy-in from ownership, sporting director and manager
- Data Scientists as part of the recruitment team
- Data needs to influence decisions
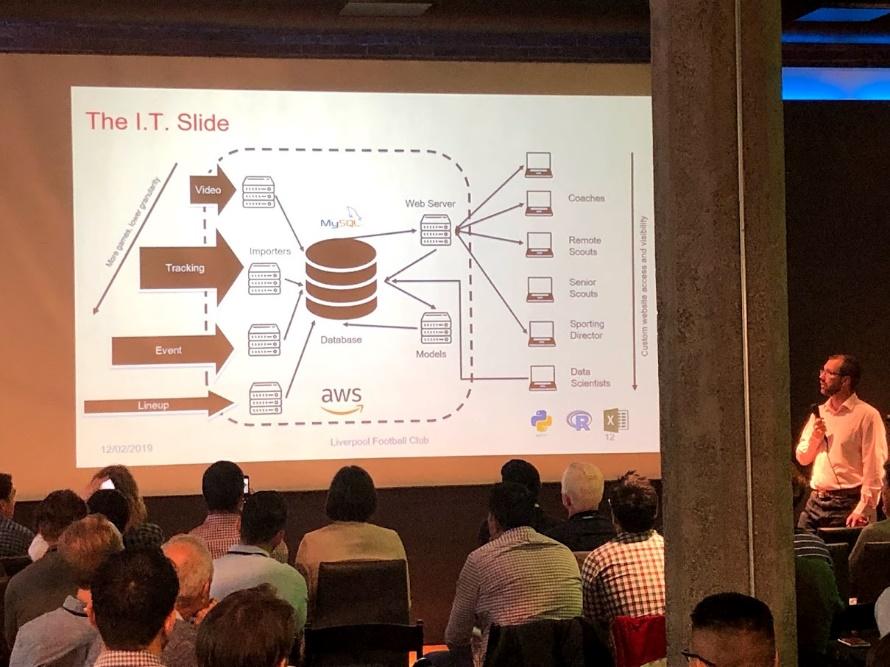
A myriad of slides from Champions League winner Dafydd Steele on Liverpool’s IT, scouting, and communication structure. Steele also presented extensively on Liverpool’s pitch value model
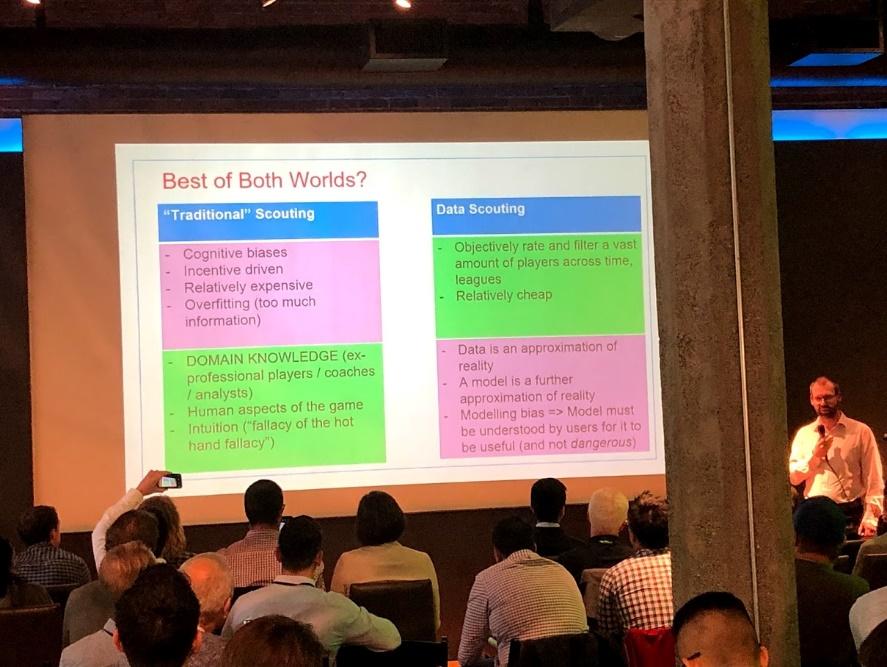
General Takeaways: I think I can speak for all the attendees when I say that this talk was absolutely fantastic. It’s not every day you get to listen to a data scientist from a club that just won the Champions League weeks prior. Because of club size and superior resources, a club like Liverpool has the ability to build out a large data team. Many clubs, even in top leagues are not afforded a similar ability. These clubs are putting out some of the best research on the market. It makes me wonder what more these club’s analytics groups are creating behind closed doors. Steele’s presentation showed his supreme knowledge of the role a “data scout” – a term that is new to me, but certainly fitting – plays in the entirety of a large club. He also understands that the coming of the new data age in football does not remove the role a traditional scout, but instead helps inform.
Day 2
Metrica Sports Ruben Saavedra, CEO – Metrica Sports
Metrica Sports
- Detection of key moments (pattern recognition technology), event data, and full match on-video visualizations
- Improving data capture capabilities
- Can now use (with a high volume of footage) much lower end video quality
General Takeaways: This is a very well thought out company. Saavedra even said his business partners took about two years to just watch the industry and find a niche they could fill. I will admit, I walked into this talk about half way through, but Saavedra was part of both Q&A segments. He demonstrated a deep understanding of the state of football analytics and the niche that his company fills.
Informing Football Skill Learning and Training Design Through Analytics Sam Robertson @Robertson_SJ, Head of Research & Innovation – Western Bulldogs (Australian Football League)
- Return to scale – a slight departure from the value of sports science
- What makes sports science valuable?
- Applying sports science to analytics to discover new insights
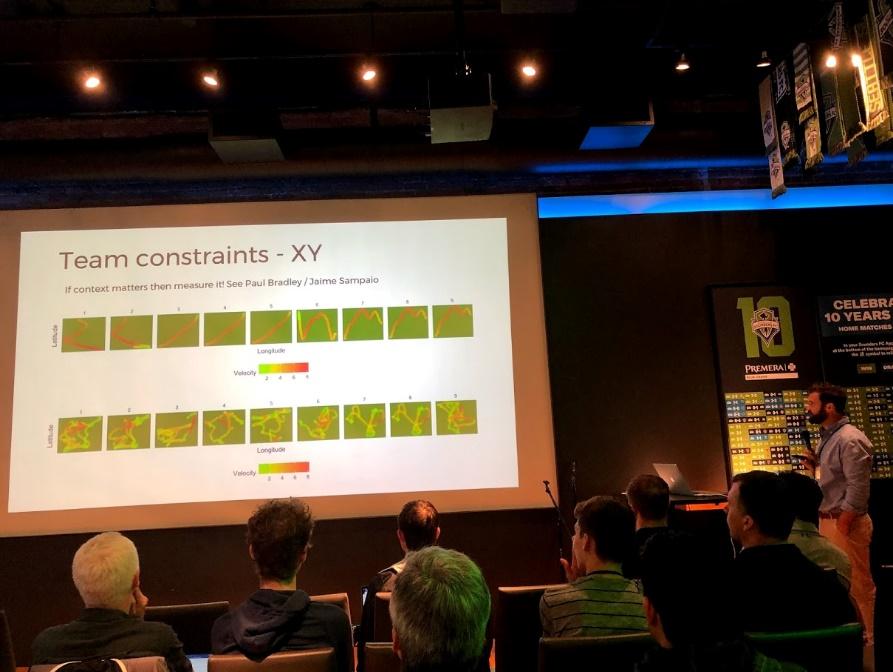
- Constraint led model applications
- Measuring physical skill and capacity
- Making complexity interpretable and (more) objective
- Bounded Rationality
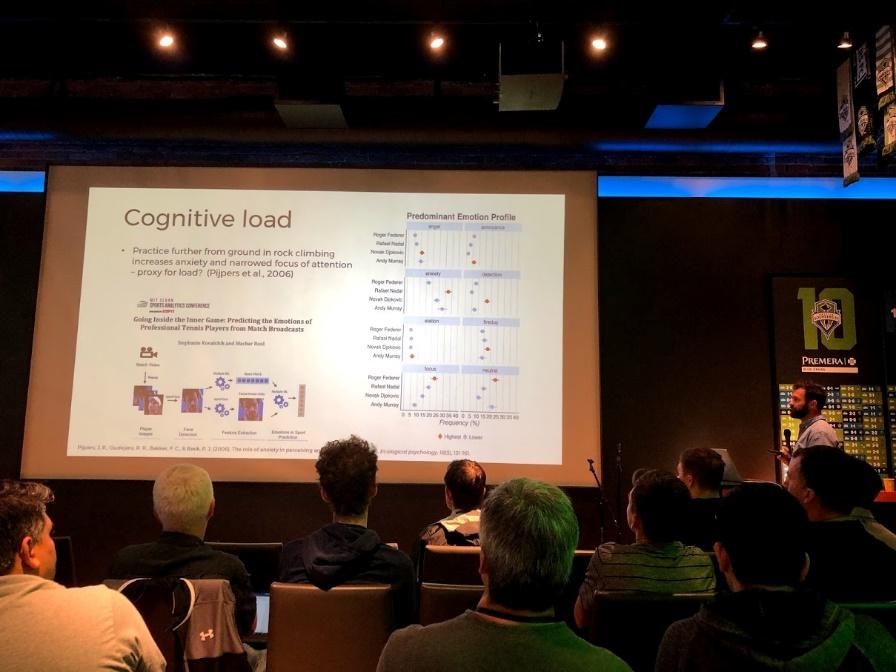
- Cognitive load
- Recognize facial anxiety
- Interpretability precedes precision
- When applying machine learning to build a model
Summary
Sport scientists in football should be investigators for improvement and a conduit for collaboration between departments/silos
Skill acquisition needs analytics in order to move the field forward
Sport science can help analytics by increasing the scope of applications and creating ultimately more jobs
Robertson took attendees through various research projects he has published in his time as Head of Research & Innovation for the Western Bulldogs of the Australian Football League
General Takeaways: Full disclosure, I actually thought Robertson was from the other AFL (Arena Football League). “Wow, I wonder how an Australian made his way to the Arena Football League?” I guess I’ll chalk this up to the late night networking the night before? Robertson presented with more of an academic focus than any of the previous presenters. He is very well published in the sports science field. After the conference I took some time to read through some of his work, which I would highly recommend if you are at all interested in sports science. I would specifically point to Fitting Motion Models to Contextual Player Behavior (Spencer, Jackson, Robertson 2017). Check all his work out at https://www.researchgate.net/profile/Samuel_Robertson Admittedly, my knowledge of sports science is quite limited, and my knowledge of Australian League Football even more limited. I’ve heard terms like RPE and cognitive load but don’t totally understand how one would capture and apply such concepts other than “this player looks tired, let’s end his training session.” I thought Robertson’s take on the state of sports science was refreshing. I feel analytics is in a similar state regarding usage of advanced metrics using both event and tracking data. I still think there are loads of insights that can be built from a basic stat line of goals, shots, possession, home/away etc. Not only are basic metrics easier to produce, they are also easier to communicate in a more concise manner. Robertson spoke on a return to the core tenants of sports science and why it has been employed in football analytics in the first place. Making complexity interpretable and (more) objective.
Evolution of MLS and Identifying Players Suited for MLS Miguel Rios @miguelrios_, Football Intelligence Manager – Opta
- Expansion clubs in the MLS
- Transfer benefits
- Starting from scratch without a culture in place can actually be a benefit (Las Vegas Knights NHL example)
- MLS Big Sells
- Almiron, Davies, Kamara
- Positive sign for league
- Allows clubs to reinvest in young talent and academy system
- Formations summary
- Teams more flexible tactically
- Used 19 unique formations in 2019 compared to 12 in 2012
- Less frequent use of 4-4-2 and 4-4-2 diamond
- 4-2-3-1 and 4-3-3 are still the most favored formations in recent years
- Back-3 based formations become more prevalent (1% in 2012 to over 10% in 2019)
- State of the MLS
- Touches in the final third increasing year over year a sign of technical growth as a league
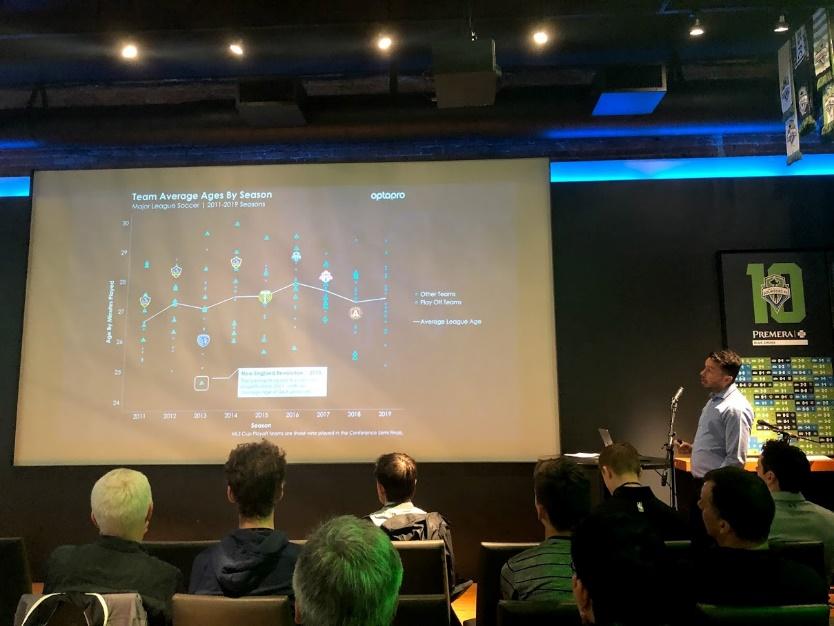
Rios #flexed with some @optapro #dataviz showing general trends of the MLS
General Takeaways: Rios has an almost unparalleled pedigree in the industry. He has worked for multiple clubs and now Opta, one of the more prominent firms in the football analytics, as the football intelligence manager. This presentation showed the best side of Opta: charts, graphs, advanced metrics. Having spent a large amount of time working for Opta’s F24 event files, I know that the backend work required to make these visuals is substantial, but it would make sense to think that Opta would be able to build these type of visuals out of their own event files. I tweeted out during the presentation that Rios was “flexing” some #dataviz which I wholeheartedly stand by. Opta have the best in-house visuals in the game at this point in time. Statsbomb are a close second. Not any huge takeaways from the conversation, but the visuals were definitely a highlight of the conference. Rios showed MLS positions acquired by team, loan market interaction, transferred player profiles, squad age profile and formation trends. The presentation itself was reminiscent of the approach Opta takes to the football analytics sphere: here is the data (F24 event files) and some stock visuals and now you do the actual analysis and build your own actionable insights. This sentiment allows for them to stay fluid and impartial in the team and league contracting space. Rios harped on some of the MLS big sells (Almiron, Davies etc) as a positive for the league. I would certainly agree. There isn’t a lack of athleticism in the MLS, but there is a lack of technical quality. As the league sells more players to bigger leagues, it will allow for continual investment in MLS academies, which will allow the league to continue to grow at the first team level.
Encoding Tactical Context into Latent Space Devin Pleuler @devinpleuler, Senior Manager of Analytics – Toronto FC
- Autoencoder
- State Machine
- K-means clustering
General Takeaways: Pleuler seemed to continue the theme of sacrificing complexity in order to better explain the tenants of a model. I did think this went somewhat against his actual presentation which centered on the largely difficult to explain concept of latent space. I also thought Pleuler spent a little bit too much time in the technical build of his model. The slide with python code probably lost a fair amount of the audience. The model itself however, is yet another fantastic application of a complex concept to bring more objectivity to football. I also really liked what Pleuler was saying about analytics as a way of saving time. The application of analytics sometimes strays from this simple concept. For a coach, let’s take the things that he/she does every day and see if we can save them time and bring more objectivity to their decision making.
Conference Overview:
Overall I thought the conference was really well done. The small space allowed for some really valuable conversation and networking amongst the relatively small MLS/American football analytics community. Events like these are extremely important over the next couple of years to continue to grow the space and share ideas. As more clubs join the MLS and hire analysts the community will undoubtedly grow. I would love MLS analysts to take the approach of NBA analysts, where (from the outside looking in) ideas and projects are shared widely amongst team analysts. As an analytics manager myself in the college space, I try to share projects and thought processes with as many other analysts as I can because, though my processes is no longer unique, I get the chance to learn from my colleagues and the overall state of our community is hopefully improved. MLS front offices largely encourage analysts to keep models and visuals in-house. Though the pay check of the analyst comes from the team, I would argue that, for the betterment of league, the collaboration and sharing of ideas league-wide will bring the overall level to a higher standard at a faster rate. I would also like the MLS to grow in its role as a resource for the in-house analysts. I’m certainly not arguing for the sharing of code and player evaluation ratings, but sharing ideas in more of a general sense. I want to give my thanks to Ravi Ramineni @analysefooty and Sounders Sports Science & Analytics @SSFCSpSci for all the hard work to bring this conference together. I’m sure it will be the first of many. See everyone next year!


very informative content on data scienceSurya Informatics
ReplyDelete