The relationship between xA and xG
One of the biggest problems in science is unreported negative or null findings. It leads to time wasted on replicating failed trials.
So with that in mind I'm going to blog about expected assists as a percentage of expected goals and why it isn't really enough to tell us anything.
My hypothesis was that we'd see the patient build up teams having relatively high xA as a percentage of xG and the longer ball teams with a low percentage.
I took the stats from Understat, stuck them into a spreadsheet and got the following results:
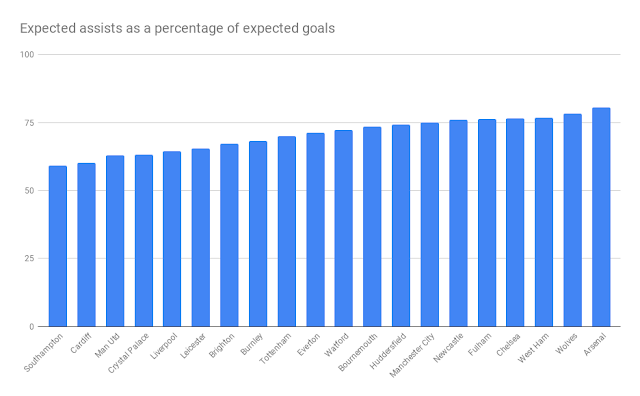 It looks OK.
Arsenal and Chelsea are high possession teams.
Cardiff and Crystal Palace more direct teams.
They are about where I thought they would be.
But then Manchester City are sandwiched between Huddersfield and Newcastle, and Liverpool and Manchester United are creating a lot more unassisted xG than my hypothesis would suggest.
My theory now is that high pressing teams like Liverpool will generate unassisted xG from forcing mistakes or turnovers. Manchester City probably do as well (like the Barkley assist at the weekend) which probably moves them leftwards in the table despite also having a lot of assisted xG.
So there we go, nice idea, but probably doesn't really tell us anything that useful.
So with that in mind I'm going to blog about expected assists as a percentage of expected goals and why it isn't really enough to tell us anything.
My hypothesis was that we'd see the patient build up teams having relatively high xA as a percentage of xG and the longer ball teams with a low percentage.
I took the stats from Understat, stuck them into a spreadsheet and got the following results:

Arsenal and Chelsea are high possession teams.
Cardiff and Crystal Palace more direct teams.
They are about where I thought they would be.
But then Manchester City are sandwiched between Huddersfield and Newcastle, and Liverpool and Manchester United are creating a lot more unassisted xG than my hypothesis would suggest.
My theory now is that high pressing teams like Liverpool will generate unassisted xG from forcing mistakes or turnovers. Manchester City probably do as well (like the Barkley assist at the weekend) which probably moves them leftwards in the table despite also having a lot of assisted xG.
So there we go, nice idea, but probably doesn't really tell us anything that useful.


Did you strip out penalties? There's some very high value unassisted xG right there...
ReplyDeleteThat chart is all goals, when I repeated for non-penalty the major mover is Manchester United (who seem to have had a lot of penalties). Doesn't xA accumulate on some of the events that result in penalties though?
DeleteI don't think Understat's xA includes penalty stuff, no. If you select a penalty on a match page, the assist section is blank.
Delete